≡ Menu

As of April 26, 2024, the National Stock Exchange (NSE) has reduced the lot size of Nifty futures and options contracts to 25 shares for all expiries, including weekly, monthly, quarterly, and half-yearly. This is a reduction from the previous lot size of 50. The NSE has also reduced the market lot of Nifty Financial Services from 50 to 25 and Nifty Midcap Select from 75 to 50, but these changes will take effect from July expiries. The lot size for Bank Nifty remains unchanged at 15.

Now the question is – do you need to change your trading strategy?

No. Do not change your trading strategy, if you win most of the time. If you lose more than 50% of the time – then you need to change your strategy anyway, or else you will keep losing. You can do my Nifty Conservative Options Course and start making consistent profits.

What about the margin?

Yes with the reduction in lot size, the margin has reduced. I see that if I create a Call Debit Spread on Nifty at 22,500 then the total margin blocked will be Rs. 11,250 – which is almost half of what was required when the Nifty lot size was 50.

For selling naked options and selling / buying naked futures – approx Rs. 64,000/- is required.  Earlier it was over 1 lakh.

What about profit and loss?

Of course, when you are risking less, the profit and loss will also reduce by the same percentage. Whatever profits you used to make earlier on one lot will now be reduced by 40-50%.

Suppose earlier when the lot size was 50 – and you made a profit of 20 points. Your profit would have been:
20 * 50 = 1000.

However now for the same 20 points profit your profit in terms of cash will be:
20 * 25 = 500 – that’s a 50% reduction.

What should you do if you are a good trader and want to make the same profits?

There is only one way out. Double the number of lots to trade. Suppose You traded with 5 lots when the nifty lot size was 50 – now to make the same profit you have to trade with 10 lots. In this case, everything will be the same. The margin blocked will be the same and the profit and loss will be the same as earlier.

However, as General Elections 2024 are going on, trading with fewer lots is recommended. Once the elections are over – you can trade with whatever number of lots you are comfortable in.

{ 0 comments }

Article written on: 27-Apr-2024 (Data based on April 2024)

Some people start worrying about a small drop in the market.

This is insane.

The recent fall is from 22,753 to 21,995.

This is in percentage terms is 3.33%. Yes points wise the fall looks huge 22753 – 21995 = 758. But in reality, it is just a 3.33% fall. This kind of fall or rise is quite common.

Here is an essential stock trading advice: Do not look at the stock markets with a microscope. This is the nature of stock markets – up and down.

For investors, the exit plan should be after 10 years or more.
For traders, the exit plan should be the target or stop loss, whichever comes earlier.

There is nothing in between. Unfortunately for most traders especially those who lose money trading (they are over 90% according to a recent study by SEBI on derivating trading) – there is everything in between.

First, they will buy an option. Seeing loss they will buy another option to average it out. They end up losing more. In reality, they should have taken a stop loss.

The story is the same for the option sellers.

Decide to take the profit target or stop loss point BEFORE placing the trade, not after. And respect that decision once the trade goes live.

And now even the brokers are advocating to hedge the trades.

You can do my option hedging course, learn hedging with proper planning, and start making small but consistent profits from your trading.

{ 0 comments }

The NIFTY Next 50 is a stock market index provided and maintained by NSE Indices. It represents the next rung of liquid securities after the NIFTY 50. It consists of 50 companies representing approximately 10% of the traded value of all stocks on the National Stock Exchange of India.

The NIFTY Next 50 index consists of stocks in the top 51-100 stocks listed in Nifty. The first 50 belongs to the Nifty 50 Index.

Trading of Nifty Next 50 derivatives will start on Wed, April 24, 2024.

Here are some important details:

Particulars Futures Options
Symbol NIFTYNXT50 NIFTYNXT50
Instrument FUTIDX OPTIDX
Tick Size Re 0.05 Re 0.05
Lot Size 10 10
Trading Cycle 3 serial monthly contracts 3 serial monthly contracts
Expiry Day Last Friday of the month, If Friday is a holiday, then expiry will be on the previous trading day
Strike Scheme Strike Interval of 100 with strikes 40-1-40 and Strike Interval of 500 with strikes 20-1-20 (Including 500 strikes due to strike interval of 100
Option Type Call European (CE) and Put European (PE)
Settlement Cash Settled Cash Settled
Daily Settlement Price The closing price of the futures contract. If illiquid, then the theoretical price will be considered
Final Settlement Price Index closing value on the last trading day Index closing value on the last trading day
Quantity Freeze 600 600 (It means a trader cannot trade more than 60 lots)
Price Band An operating range of 10% of the base price
Spread Contracts M1-M2; M1-M3; M2-M3

Expiry cycle:

On April 24, 2024, the following expiry cycle will be available:

Expiry Cycle Expiry Day
May-2024 May 31, 2024
June-2024 June 28, 2024
July-2024 July 26, 2024

You can check the announcement from the exchange here:

What you should do?

Do not get enthusiastic and start trading now. All options in any contract behave the same way. Whether it is Nifty 50 Nifty Next 50 or Bank Nifty derivatives contracts.
Watch the volume and then decide. If the volume in the Nifty Next 50 derivatives is low – it makes the trading difficult. Low volume creates slips between the prices. You will see LTP as 20 and when you will buy the options you may get it for 22. That’s a 10% difference.
Why does this happen? Because of the low volume of any contract, the gap between the Ask and Bid prices is wider. Ideally when the volume is good the Ask and Bid do not differ more than 1% even less. Nifty and
Banknifty are still the most traded options and futures contracts. The rest are yet to catch up. When the results are the same why take extra risk?
So wait, watch and then trade.
{ 0 comments }

The Volume Weighted Average Price (VWAP) is an average price of a stock or asset for a specific period with calculations considering the volume traded at various prices.

Volume-weighted average price (VWAP) is a technical indicator that shows the average price of a financial asset based on its volume and price. It’s calculated by dividing the value of a security by the total volume of transactions during a trading session, and then adjusting the result in real time until the session ends. VWAP is often used in intraday charts, where time frames are set on a minute, second, or hourly basis.

In short, it considers the volume of the stock at different prices to be an indicator or a good price for intraday trading.

It is said that this indicator combines the three most important ingredients of a stock chart, which are price, volume, and time.

The traditional VWAP is calculated over that trading day – starting at the beginning of the day or session.
It is also known as the session VWAP or daily VWAP.

The VWAP originated in 1988 as a way for institutional investors to benchmark the prices they received for their purchases.

Did they end up buying the asset better or worse than the average price – or, in this case, the volume-weighted average price?

VWAP has been adopted by many traders as a technical indicator for entries and exits.

VWAP has been adopted by many traders as a technical indicator for entries and exits. Nowadays even algos are made to trade with VWAP data.

Which Traders use VWAP?

Mostly intraday traders use it in equities, forex and commodities.

TIP: Stock market trading is risky anyway so by trading commodities you are increasing the risk many fold.

Why?

Commodities change their prices too soon, too often and aimlessly. Commodities trading is 100% fluke trading. When you are trading stocks at least you know the fundamentals of the company, the profit and loss, debt, balance sheet etc. However, in Commodities, you have ZERO idea of what will happen in future.

I am not in favour of commodities being traded in stock markets at all – but I am not in the government so the only thing I can do is never trade commodities. I have given you a reason why you shouldn’t trade commodities. Now it is up to you to take my advice seriously or not.

The VWAP is used by many day traders (in equities, forex, or futures) on shorter intraday time frames.

Using VWAP To Determine Bullish Or Bearish

For most traders, if the price is above VWAP, there is bullish sentiment and if the price is below VWAP, there is bearish sentiment in the markets. So if the price is above VWAP – they will buy the stock and if the price is below VWAP – they will short the stock.

Day or short-term traders both follow the above rule.

What do longer time frame investors do?

Longer time frames mean 3 to 6 months. These investors are looking for 10-18% returns. These investors along with the above rule on VWAP also look at the 200-day moving average to determine whether to buy or sell.

TIP: Moving averages of 100 or 200 days are in my experience a very good indicator to guess the stock’s future move at least for the short term (2-3 months).

Moving averages are more common than the VWAP method. Moving averages are far more simple to understand and easy to calculate. Nowadays there are many websites/apps available which calculate some basic technical analysis of companies including moving averages. You can use them to make a trading decision.

Slope Of The VWAP

The slope of the VWAP line is important. If it is sloping up, the average price is increasing. If it is sloping down from left to right, then the price is generally moving lower. If the VWAP is horizontal, price action is choppy and generally moves sideways.
Horizontal VWAP is very difficult to trade because it does not give any idea of buying or shorting.

Some traders may take a mean reverting trade (contradictory trade) – this is exactly the opposite of the trade idea written above.
This is the mean reverting trade – if the price is above VWAP traders think that with time the stock price will revert to VWAP – therefore they are short. Similarly, if the price is below VWAP – traders think that with time the stock price will revert to VWAP – therefore they buy.

Using VWAP As Support And Resistance

Like major moving averages, the VWAP can sometimes act as support and resistance.

A trader waiting for trades to go long would have found good entries when the price pulled back to VWAP, which acted as support; then, put stops below VWAP.

Frequently Asked Question

Q – Who invented the VWAP?
A – It is believed to have been invented by mathematician Paul Levine.

Q – Why is VWAP more popular than moving average?
A – The typical moving average (such as the 50-period moving average or the 200-period moving average) does not consider volume. The VWAP uses volume, meaning that every stock share has a vote in determining the VWAP value.

Q – Do institutional trading algorithms use the VWAP?
A – Yes, a good percentage of them do.

Q – How is VWMA different from VWAP?
A – Volume-weighted moving average (VWMA) fundamentally differs from volume-weighted average price (VWAP). While VWMA does incorporate the volume of shares into its calculation, it is still more like the traditional moving average, such that the oldest data is dropped when new data comes in.

VWAP is different in that it never drops off any data once it starts picking up data from its anchor point. It is a cumulative average price instead of a rolling average price.

If you have any questions, please leave a comment below.

Disclaimer: The information above is for educational purposes only and should not be treated as investment advice. Any reader interested in this strategy should do their research and seek advice from an authorized financial advisor.

{ 2 comments }

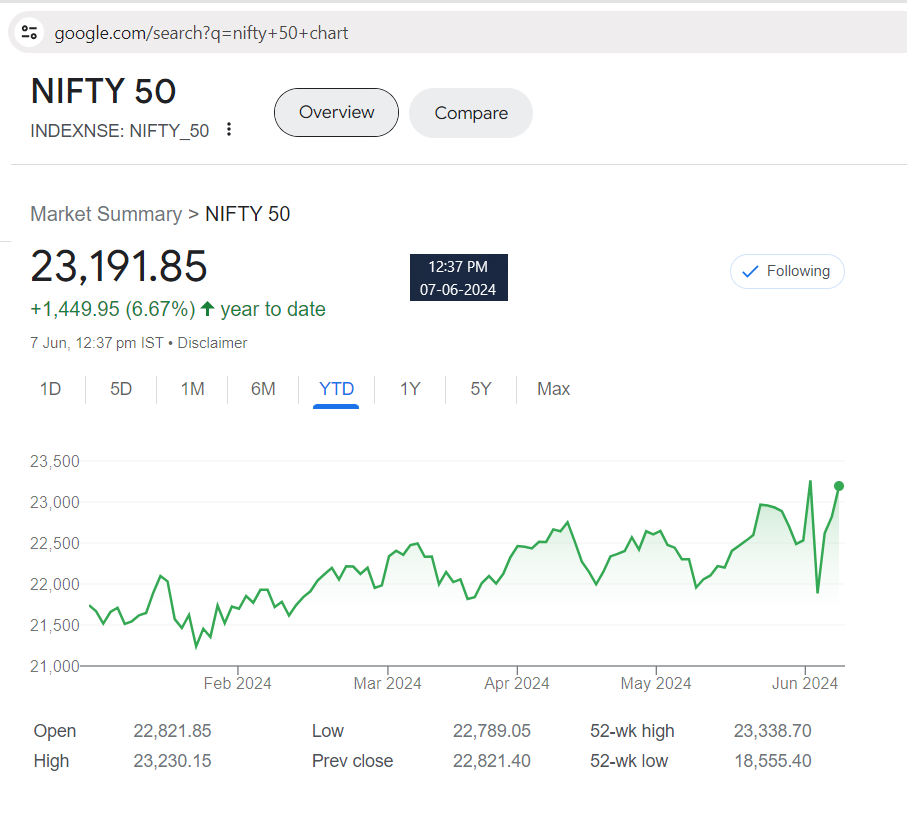
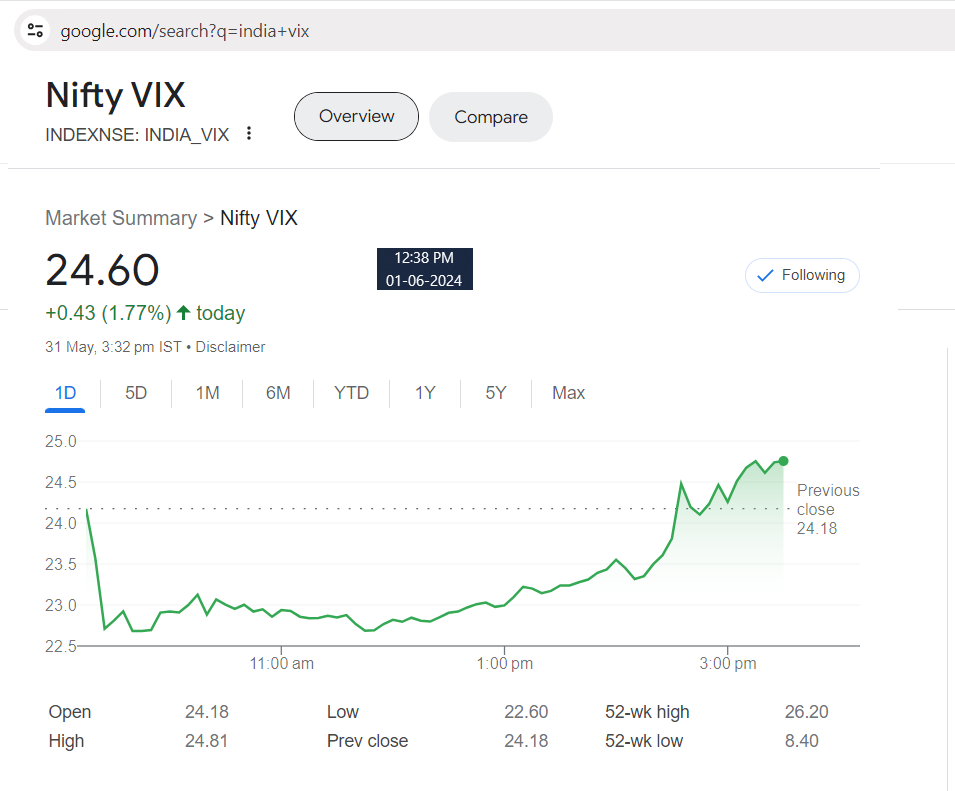
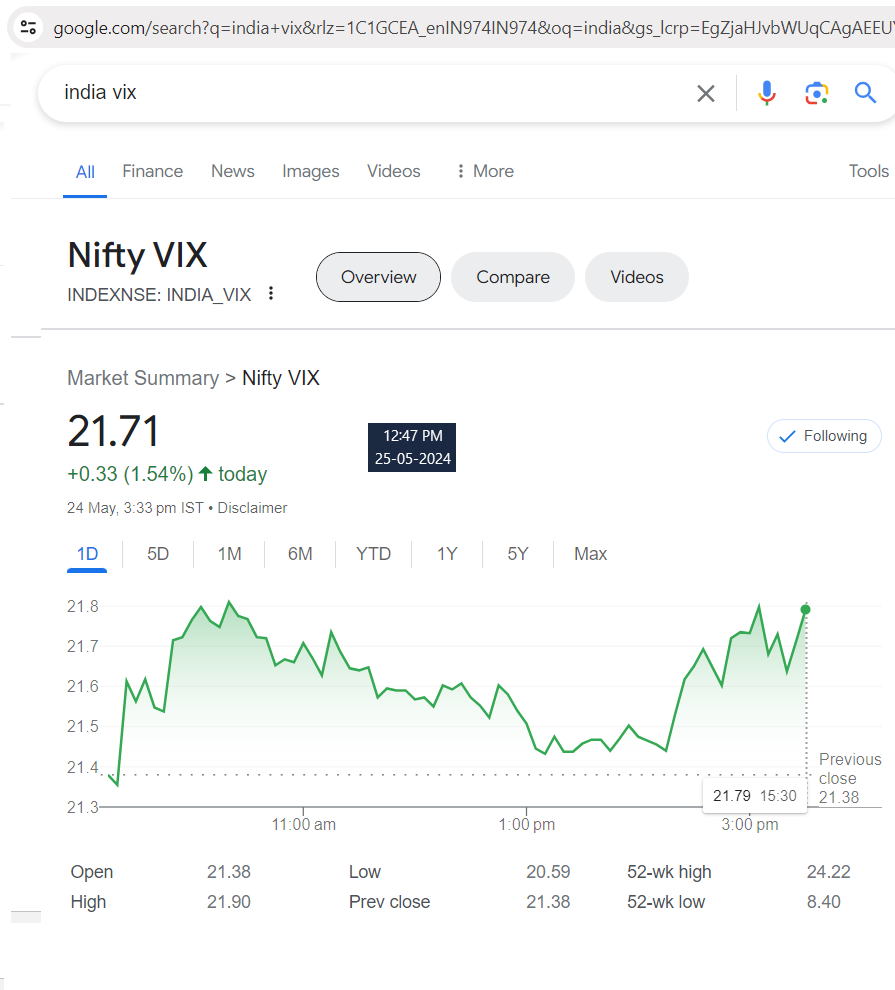
Today (Monday – 15-Apr-24) is the day when INDIA VIX and Nifty behaved exactly as they are meant to be. INDIA VIX and Nifty are inversely proportional.

See the screenshot below. The time and source of the screenshot are inside the pic itself:

INDIA VIX Mon, 15-Apr-24

Nifty 50 Mon, 15-Apr-24

I have written about this earlier also. You can read them here:

India VIX Has Started To Rise As Elections Are Approaching

India VIX at a Very Comfortable Level What it Means

How To Trade Intraday With Help From India VIX

India VIX is A Very Important Indicator of Overall Market Direction

What Kinds of Strategies to Apply as Per India VIX

India VIX Increasing by 22% in a Single day is Not Good

If India VIX is Low Options Premium Will Also be Low

How India VIX Is Calculated and What to Expect After Seeing High or Low India VIX

Impact on Nifty Bank Nifty India VIX due to General Elections 2019

How does INDIA VIX help in trading options?

You can get an idea. If INDIA VIX has risen from the previous day option premiums will likely increase giving a great opportunity to sell.

However, you need to hedge them else on paper you can suffer unlimited loss. But loss is only till you decide to take a stop loss. This means that option selling on paper has an unlimited loss – the real loss is when you take a stop loss or the max-margin blocked to sell option.

With hedging the maximum margin blocked will reduce by 75%. Naked option selling is dangerous. In a black swan event, a naked option seller may lose 100% capital deployed to sell the option.

Therefore you must always hedge options sold and all futures trading. Whether it is a future buy or sell trade – both on paper are unlimited losses. Again if you hedge futures with options the margin to trade futures will reduce by 75%.

You can do my course and learn strategies to hedge both options and futures.

{ 0 comments }

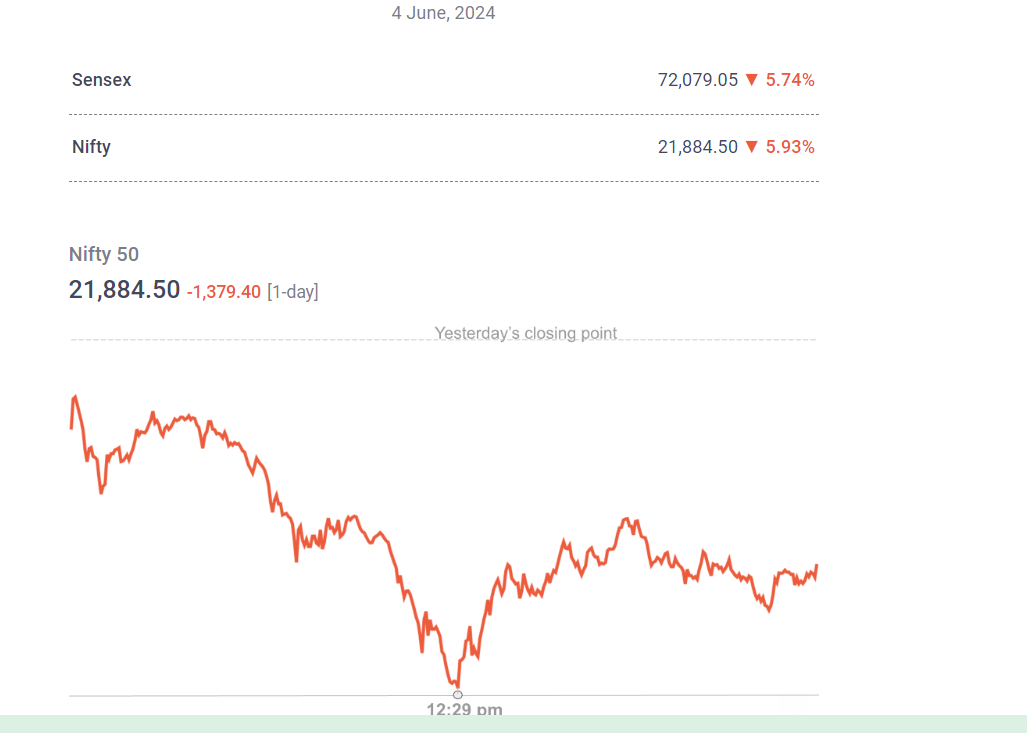
INDIA VIX and Stock Markets are inversely proportional. But there are exceptions – like this General Election 2024.

General elections will be held in India from 19 April 2024 to 1 June 2024 to elect the 543 members of the 18th Lok Sabha. The elections will be held in seven phases and the results will be announced on the 4th of June 2024.

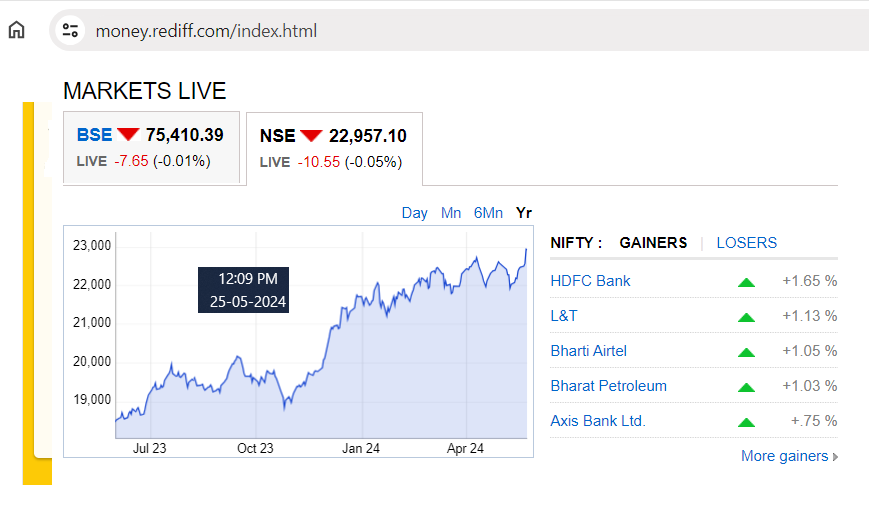
Markets have high expectations that NDA led by current Prime Minister Mr. Modi will again win the elections and come back to power – and chances are high that NDA will win again. Therefore as you can see in the last year NSE kept rising.

And this may happen till the 4th of June 2024. This means both INDIA VIX and Indian Stock Markets will rise. Thus the INDIA VIX and Indian Stock Markets moving inversionally proportional to each other rule may not apply.

NSE 03-Apr-24

In that case at least till the 4th of June 2024 – when the election results will be out – Nifty may not fall much. Even if it does – like recently, it will quickly come up. That doesn’t mean you start buying Nifty or Stock Futures because whatever I say is an assumption – but a highly likely assumption.

In a situation such as this, no technical analysis will work. Panic trading will start increasing as the elections will approach. This will lead to an increase in INDIA VIX. Volatility increase will lead to swift movements in stocks and indices. This will lead to profit / stop loss hitting faster than normal times.

What you can do as a trader?

Until the 4th of June 2024 trade very cautiously. Hedge your trades and reduce the lot size. Reducing the lot size for the next 2-3 months will not make you poor even if you are a good trader. And if you are a bad trader, reducing the lot size will reduce your losses.

Hedging the trades reduces the chances of losses and increases the chances of profits. By doing my Nifty and Banknifty course you learn proper hedging. My course details are here.


{ 0 comments }

This post was sent via newsletter to my email subscribers on Mar 14, 2024.

I think you already know why the markets are crashing. So I will not write much about it. If you do not know it’s because The Securities and Exchange Board of India (Sebi) chairperson, Madhabi Puri Buch, on Monday (11-Mar-2024) raised concerns over stretched valuations of small- and mid-cap stocks, which are mainly bought by retail investors. Since Jan 22. You can read more here:

Let’s look at the returns.

In the Equity: Small Cap sector in the mutual funds the highest 1-year return as of 12-Mar-2024 is 64.42% (Bandhan Small Cap Fund – Direct Plan)

In the Equity: Mid-Cap sector in the mutual funds the highest 1-year return as of 12-Mar-2024 is 63.58% (Edelweiss Nifty Midcap150 Momentum 50 Index Fund – Direct Plan)

Yes, such returns will not come year-on-year, correction is due anytime or stagnancy will be long – very long.

No, I am not recommending the above funds. It is just data which I had to use in this email. Whether to invest in these funds or not is your decision. Whatever you do – never invest a lumpsum amount. Always do a monthly SIP (not daily and not quarterly). Monthly SIPs are manageable and get the best rupee cost averaging.

WHAT YOU CAN DO IF INVESTED IN SMALL AND MID-CAP STOCKS?

The real reason to write this email is to inform you that if you are heavily invested in small and mid-size companies and if they have generated more than 50% return in the last year – then book some profit.

If you bought the stocks to invest for a long time – I would still recommend booking profit in at least 30% of the stocks. If you bought them for the short term in mind then it’s time to exit and book full profit.

One stock that may give good returns is ITC in the short term.

Why?

ITC shares were yesterday bought by ICICI Pru MF, Government of Singapore, Nippon India MF, DSP MF, SBI MF, Max Life Insurance Company and Kotak Mahindra MF offloaded by BAT.

Disclaimer: Not an advisory – please take your own decision before buying. Full disclaimer here.

{ 0 comments }

If you sell options or trade futures it is highly recommended that you ask for a collateral margin against the stock holdings in your Demat account from your broker and trade futures and options with that money without bringing extra money into your trading account.

However, collateral margin money comes with terms and conditions. Kindly read about them on your broker’s website before taking the collateral margin.

For example, ZERODHA’s terms for  collateral margin are:

  • A fee of ₹30 + GST per instrument, irrespective of the quantity pledged. Whether you pledge 10 shares of a company or 100s shares, the fee will be ₹30 + GST.
  • The collateral margin will be available on T+1 day for the stocks that are pledged before 5 PM.
  • When using collateral margin to trade F&O, the shareholder must have 50% of the margin requirement in cash or cash equivalents. If not, interest at 0.035% per day will be charged on the cash component funded by Zerodha.

    This means if the margin blocked is 100,000 to trade a stock/index future, the collateral margin that can be used for funding this margin without any interest is 50,000. Anything above this will be charged 0.035% per day until the trade is closed.

  • Use of collateral margins from pledging the holdings will only be allowed with a positive cash balance. If your account has a negative cash balance then collateral margin will not be given.
  • Zerodha can sell the stocks that are pledged if the trade is closed in a loss which is more than the free cash used to fund the trade. In the above example up to 50k was used by the client – but 50k was funded by Zerodha as collateral margin. If the loss is 60,000 then Zerodha can sell the stocks that were pledged to recover 10.000. So be very careful if you pledge your stocks for collateral.
  • Pledged stocks will be considered for physical delivery obligations if stock F&O contracts expire In The Money (ITM).

My advice: If you are a disciplined trader and always trade with a hedge then there is nothing wrong with getting collateral. In any case, a hedge reduces the total margin blocked – so it is highly unlikely that you will ever pay any interest for the margin you are using.

Plus the hedging will ensure the loss if any is also less – this will make sure your stocks are not sold by Zerodha or your broker.

Kindly read your broker’s terms and conditions for pledging shares before pledging your shares to get the collateral margin.

You can do my Conservative Option Course to learn the best way to hedge options and futures and start making a monthly income.

{ 0 comments }

This post was written on 18-Feb-2024 and sent to my newsletter subscribers.

India VIX has started to rise as elections are approaching

If you trade options you must know that when any major event happens India VIX starts rising. With this two things happen:

1. Volatility in the markets increase
2. Option prices also increase

India VIX and Nifty are inversely proportional – but this time the case will be different. There is a 90% chance that the BJP will come to power – so BOTH will increase India VIX and Nifty.

What can you do?

Hedge options and futures as in volatile markets only hedging will keep your money safe.

Start buying good stocks mainly for short-term returns.

If BJP does not come to power by chance, the markets will fall by at least 10%.

Therefore if you are buying stocks for the short term then book profits before the Genreral Eection 2024 results are out.

{ 0 comments }

Indian stock markets are near an all-time high. Not only that but it has gone up continuously since the last 12 months.

Here are a few things you should and should not do:

  • 1. If any stock is there that you feel has not gone up in this rally and therefore may go up – do not invest in that stock. There is a high chance that it may not go up soon. There must be some reason why it did not participate in the rally and therefore is a risky investment.
  • If a stock performed very well in the rally and you want to take your chances thinking that it may keep going up then spread your investment in equal parts in the next 6 months.

For example, if you have 60,000 to invest then buy stock worth 10k of that company, remember the date and on the same date for the next 5 months buy that stock. You will end up getting the best average rate possible. In one or two or maybe all months, the stock will be lower than the price you paid to buy in the previous month. Even if the stock keeps going up – by the time it reaches the 6th month you will be in good profit and if your view was to invest for the short term – you can exit the stock with profits in the sixth month itself.

{ 0 comments }
Menu